超多 SRE 部落格 blog 文章都說在使用 Grafana 與 Prometheus 來監控他們的 K8S
# Prometheus 是什麼
# 是一個 Time Series Database (TSDB)
# 可以收集監控主機的數據,也可以圖形化查看
# Prometheus 自家提供了 node_exporter 可以查看主機的 CPU、硬碟等
# 還有超多其它 exporter 可以用,比如 MySQL、Apache 、Nginx 、HAProxy 等
# Grafana 是什麼
# 可以把數據來源都圖形化,集中管理
# 支援 Prometheus、InfluxDB、Elasticsearch 等
# 怎麼應用
# 你可以單台或多台 Prometheus 來監控收集主機資料,然後統一放到 Grafana 裡呈現
<host with node_exporter> ----> <Prometheus> ----> +---------+
                                                   | Grafana |
<host with node_exporter> ----> <Prometheus> ----> +---------+
我環境測試 OS 用 AlmaLinux release 8.8 (Sapphire Caracal)
# 安裝設定 Prometheus
# 建立使用者
mkdir -p /var/lib/prometheus
useradd --no-create-home -s /bin/false -d /var/lib/prometheus prometheus
# 下載 Prometheus
wget https://github.com/prometheus/prometheus/releases/download/v2.46.0/prometheus-2.46.0.linux-amd64.tar.gz
tar xvf prometheus*.tar.gz
cd prometheus*/
mkdir /etc/prometheus
mv prometheus.yml /etc/prometheus/prometheus.yml
mv prometheus promtool /usr/local/bin/
mv consoles/ console_libraries/ /etc/prometheus/
chown -R prometheus:prometheus /etc/prometheus
chown -R prometheus:prometheus /var/lib/prometheus
# 啟動 Prometheus
sudo -u prometheus /usr/local/bin/prometheus --config.file="/etc/prometheus/prometheus.yml" --storage.tsdb.path="/var/lib/prometheus/"
# 或
vim /etc/systemd/system/prometheus.service
[Unit]
Description=Prometheus
Wants=network-online.target
After=network-online.target

[Service]
Type=simple
User=prometheus
Group=prometheus
ExecStart=/usr/local/bin/prometheus \
    --config.file /etc/prometheus/prometheus.yml \
    --storage.tsdb.path /var/lib/prometheus/ \
    --web.console.templates=/etc/prometheus/consoles \
    --web.console.libraries=/etc/prometheus/console_libraries

[Install]
WantedBy=multi-user.target
systemctl daemon-reload
systemctl start prometheus.service
# 確認 Prometheus 是成功的
可以瀏覽 http://localhost:9090/
# 不過 Prometheus 9000 port 是裸奔的,記得設定防火牆、或認證
# 安裝設定 node_exporter
# 是一個 agent 程式,安裝在被監控的主機上
# 讓 prometheus 可以直接透過 metrics 查詢主機資料
# 下載 node_exporter
wget https://github.com/prometheus/node_exporter/releases/download/v1.6.1/node_exporter-1.6.1.linux-amd64.tar.gz
tar xvfz node_exporter-*.*-amd64.tar.gz
cd node_exporter-*.*-amd64
mv node_exporter /usr/local/bin
# 啟動 node_exporter
sudo -u prometheus /usr/local/bin/node_exporter
# 或
vim /etc/systemd/system/node_exporter.service
[Unit]
Description=Node Exporter
After=network.target

[Service]
Type=simple
User=prometheus
Group=prometheus
ExecStart=/usr/local/bin/node_exporter

[Install]
WantedBy=multi-user.target
systemctl daemon-reload
systemctl start node_exporter.service
# 確認 node_exporter 是成功的
可以瀏覽 http://localhost:9100/metrics

# 不過 node_exporter 9100 port 是裸奔的,記得設定防火牆、或認證
# 在 prometheus 加入 node
# 把剛剛的 node_exporter 監控的主機放入 prometheus
vi /etc/prometheus/prometheus.yml
# 在 scrape_configs: 底下加入新的 job (注意空隔格式) (也可以加入多台)
  - job_name: node
    static_configs:
      - targets: ['localhost:9100']
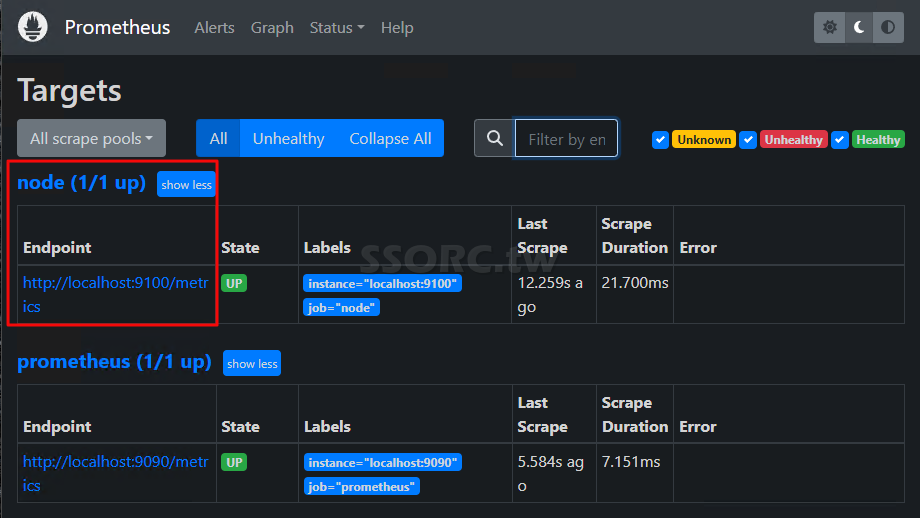
# 重啟 prometheus
# 在 prometheus 的 http://localhost:9090/targets 裡可以成功看到多了 localhost:9100 這個 node
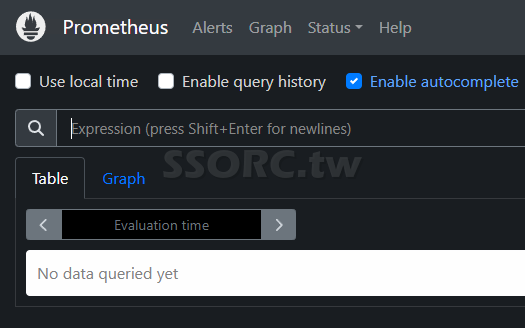
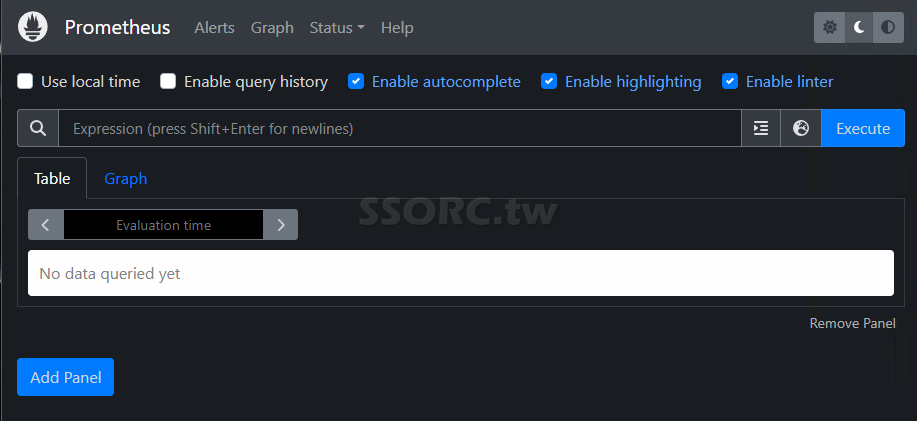
# 開始測量
# 在 http://localhost:9090/graph 的查詢欄位裡輸入關鍵字 node_ , 會有很多 node 相關的 Metrics 可以用
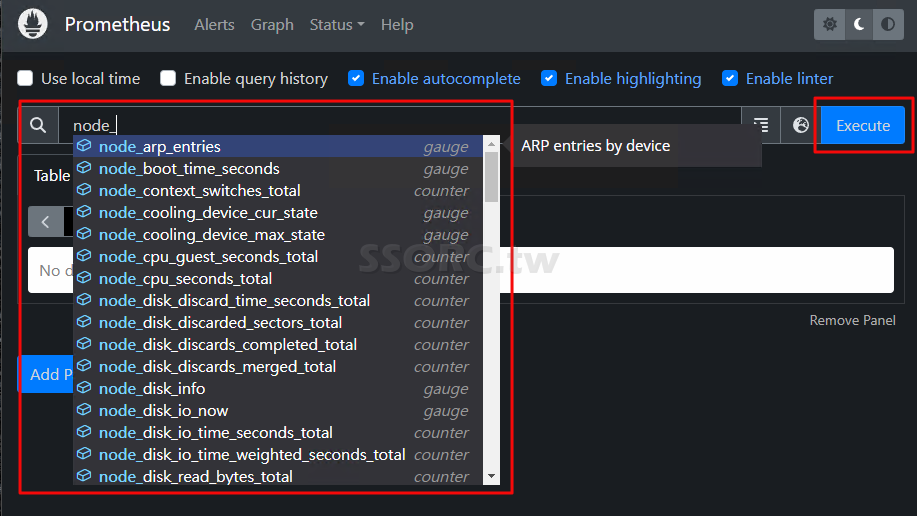
# 可以選擇 node_load1 後按 Execute
# 在下方的 Table 裡會有查詢語言 (叫作 PromQL)
# 在下方的 Graph 裡會有圖形化
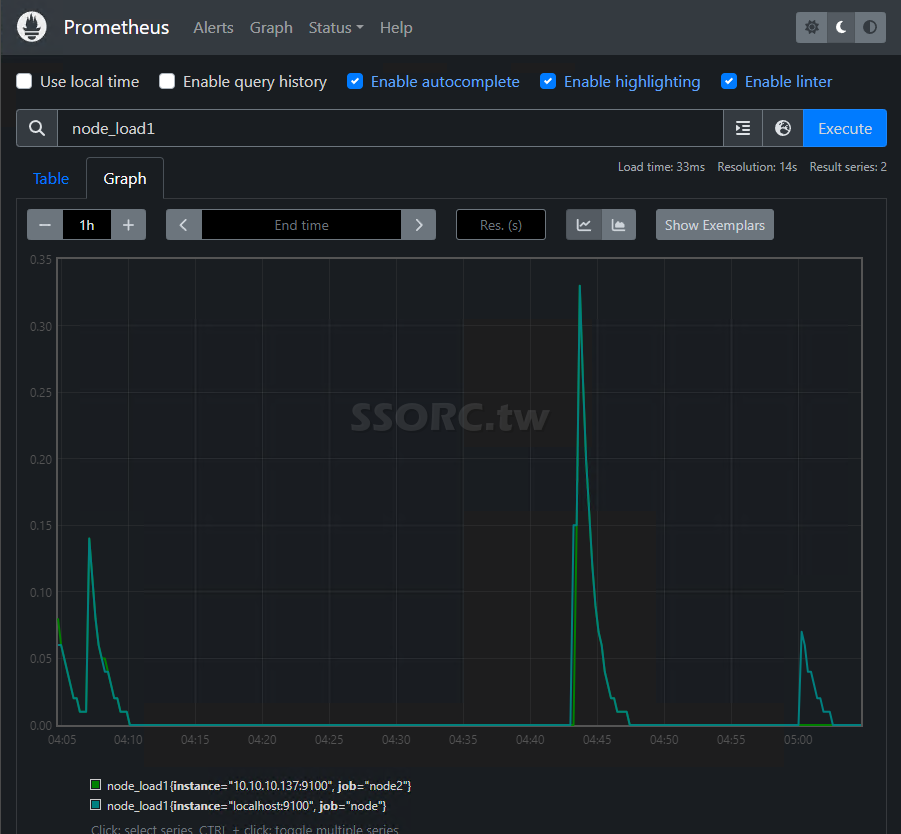
# 可以安裝使用 stress-ng 做些壓力測試,測 CPU、IO、DISK 等,可以讓曲線出來
# 不過 prometheus 的圖形化比較陽春
# 所以搭配了 grafana
# 使用 grafana 10.0.3 (2023-07-26) 版本
# 安裝設定 Grafana
# 也可以參考 使用 influxdb + telegraf + grafana 收集主機資料、監控,並圖形化分析
# 新增 yum repos
vim /etc/yum.repos.d/grafana.repo
[grafana]
name=grafana
baseurl=https://packages.grafana.com/oss/rpm
repo_gpgcheck=1
enabled=1
gpgcheck=1
gpgkey=https://packages.grafana.com/gpg.key
sslverify=1
sslcacert=/etc/pki/tls/certs/ca-bundle.crt
# 安裝 grafana
yum install grafana -y
# 啟用 grafana
systemctl start grafana-server
# 登入 (admin/admin 登入) (首次登入要改預設密碼)
http://localhost:3000/login
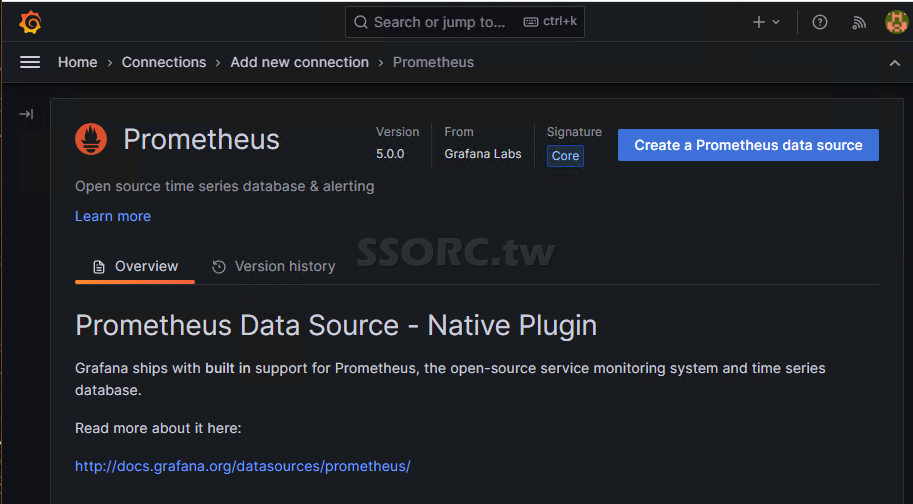
# 在 connections 的地方 (左邊上方MENU) ,新增選擇 Prometheus ,再點擊 Create a Prometheus data source (右上方)
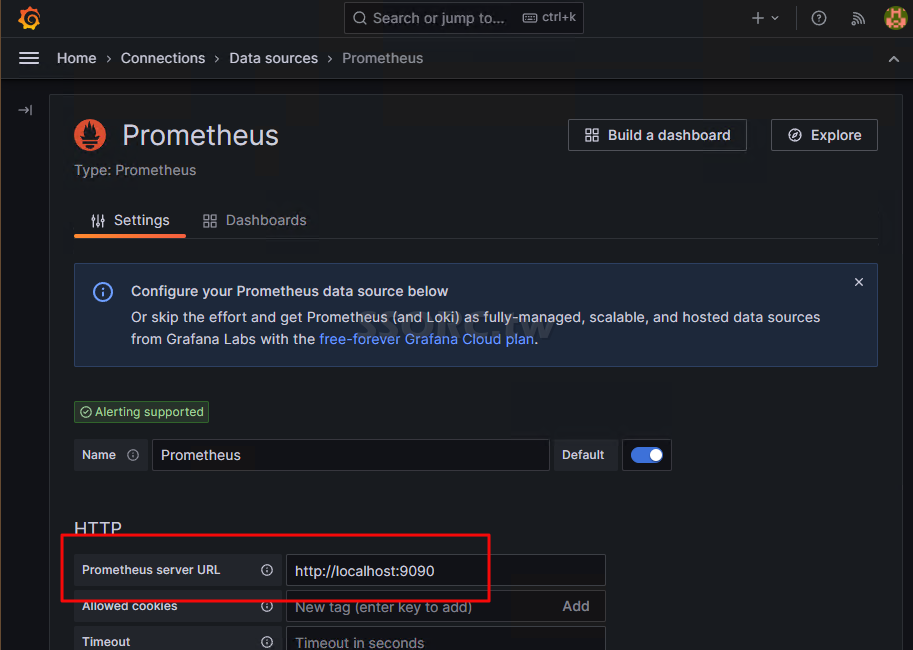
# 在 Prometheus server URL 輸入 http://localhost:9090 後 save & test
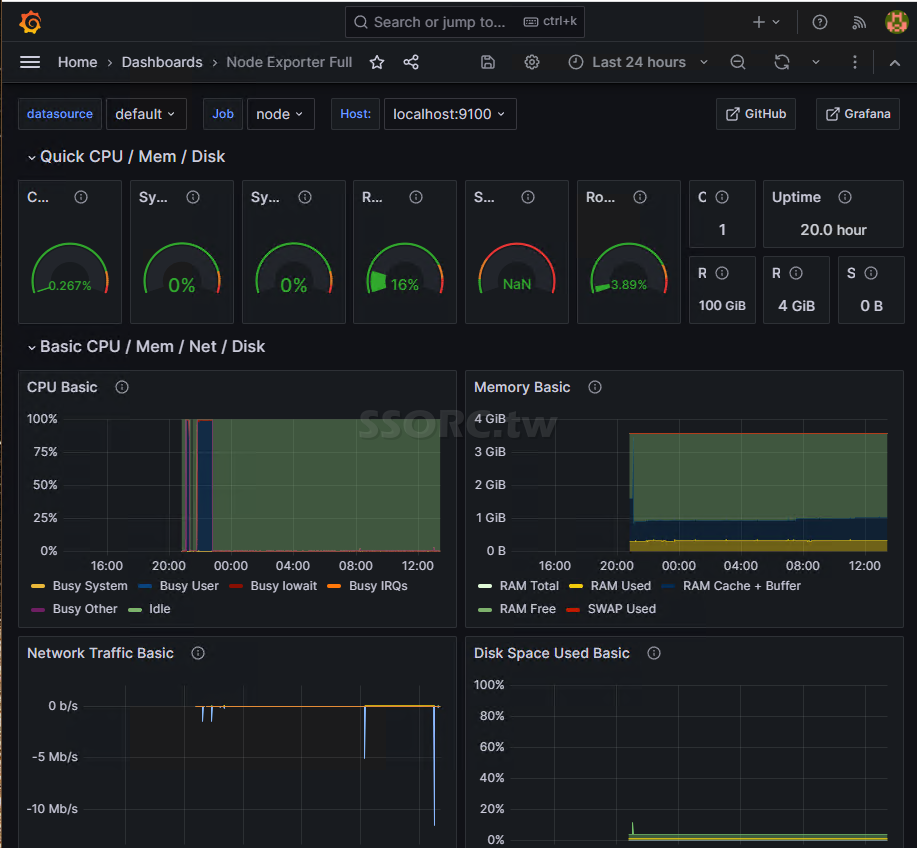
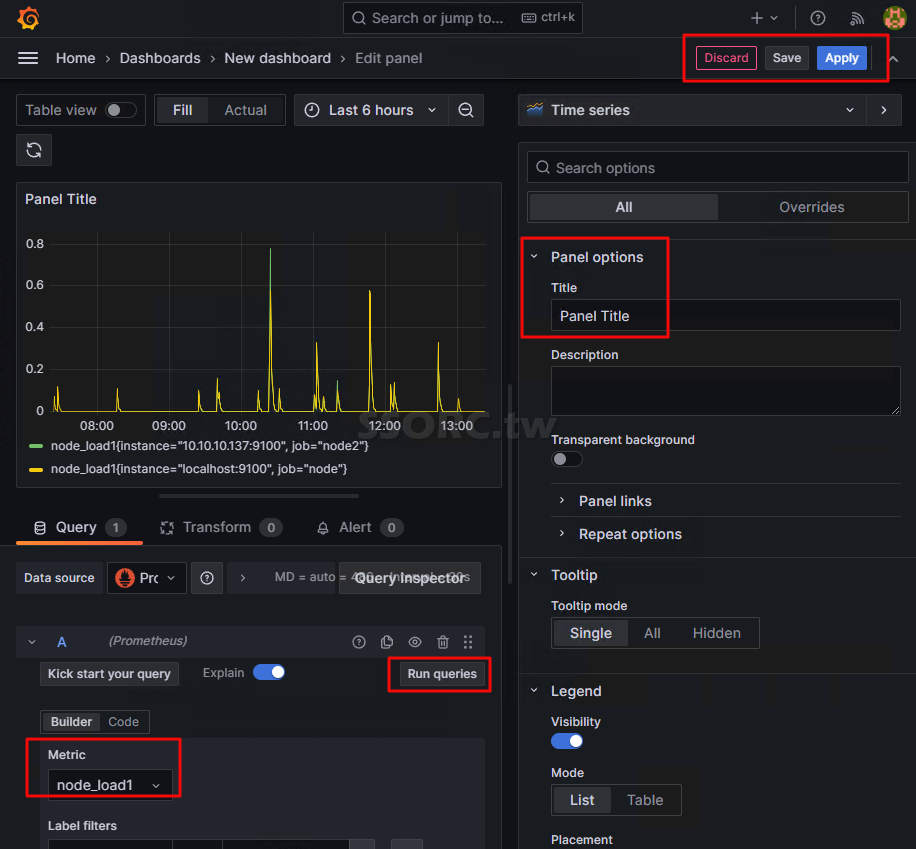
# 建立 dashboard
# 到這裡你可以選擇自建 dashboard
# Build a dashboard > Add visualization > 選擇 data source prometheus > 再儲存套用
# 或者到 https://grafana.com/grafana/dashboards/ 搜尋 node_exporter
# 選擇現成的 Dashboards 範本的 ID ,回到 grafana 做 Import Dashboards 匯入 (右上角 + 號下拉)