
influxdb 是一個資料庫,time series 的資料庫,一些操作滿像 MySQL,不同的是可以直接對 influxdb 用 curl 新增刪除修改資料。
telegraf 是一個種在主機 Server 上的 agent,用來收集資料用的收集器。支援 Linux 與 Windows
grafana 將資料圖形化
流程
主機 Server -----> telegraf -----> influxdb -----> grafana
環境
CentOS7
網路
      [server1]     [server2]       [server3]
          +             +               +
     (telegraf)    (telegraf)       (telegraf)
          |             |               |
          +-----------> | <-------------+                       + (influxdb) --------------> (grafana) ---> [manager]
############################
# 安裝 influxdb
############################
vi /etc/yum.repos.d/influxdb.repo
[influxdb]
name = InfluxDB Repository - RHEL \$releasever
baseurl = https://repos.influxdata.com/rhel/\$releasever/\$basearch/stable
enabled = 1
gpgcheck = 1
gpgkey = https://repos.influxdata.com/influxdb.key
YUM
yum -y install influxdb
啟動
systemctl start influxdb
執行 influx 登入資料庫,然後建立 admin 最高權限,這裡就像是 MySQL 的 root,只是我用 admin (一開始是沒有任何使用者的,任何人、來源皆可登入)
influx
CREATE USER admin WITH PASSWORD 'adminpass' WITH ALL PRIVILEGES
再來為了安全性,讓登入 influxdb 一定要有權限
vi /etc/influxdb/influxdb.conf
[http]
  auth-enabled = true
重啟 influxdb
systemctl restart influxdb
登入
influx -username 'admin' -password 'adminpass'
驗證一下
show databases
show users
也可以用 curl (如果帳密故意用錯出現 {“error”:”authorization failed”} 才是安全的) (預設是 8086 的 port)
curl -G http://1.1.1.1:8086/query -u admin:adminpass --data-urlencode "q=SHOW DATABASES"
建立資料庫,讓 telegraf 可以塞資料到 influxdb
create database telegraf
create user telegraf with password 'metricsmetricsmetricsmetrics'
grant all on telegraf to telegraf
show databases 時可以看到 telegraf 資料庫就 ok
influx -username 'telegraf' -password 'metricsmetricsmetricsmetrics'
show databases

# 或
curl -G http://1.1.1.1:8086/query -u telegraf:metricsmetricsmetricsmetrics --data-urlencode "q=SHOW DATABASES"
像這樣子
Connected to http://localhost:8086 version 1.7.2
InfluxDB shell version: 1.7.2
Enter an InfluxQL query
> show databases
name: databases
name
----
telegraf


# 或
{"results":[{"statement_id":0,"series":[{"name":"databases","columns":["name"],"values":[["telegraf"]]}]}]}
其它
# 使用資料庫
use telegraf

# show tables
SHOW MEASUREMENTS
後記 : 記得設定防火牆 8086 port
############################
# 安裝 telegraf
############################
YUM
yum -y install telegraf
vi /etc/telegraf/telegraf.conf
[[outputs.influxdb]]
  urls = ["http://127.0.0.1:8086"]
  database = "telegraf"
  username = "telegraf"
  password = "metricsmetricsmetricsmetrics"
啟動
systemctl start telegraf
測試
telegraf -test -config /etc/telegraf/telegraf.conf --input-filter cpu
telegraf -test -config /etc/telegraf/telegraf.conf --input-filter disk
telegraf -test -config /etc/telegraf/telegraf.conf --input-filter diskio
telegraf -test -config /etc/telegraf/telegraf.conf --input-filter mem
telegraf -test -config /etc/telegraf/telegraf.conf --input-filter processes
telegraf -test -config /etc/telegraf/telegraf.conf --input-filter swap
telegraf -test -config /etc/telegraf/telegraf.conf --input-filter system
telegraf 提供產生 conf 內容的指令 (但這裡我尚且用不到)
telegraf config -input-filter cpu:mem:disk:swap:system -output-filter influxdb > telegraf.conf
############################
# 安裝 grafana
############################
vi /etc/yum.repos.d/grafana.repo
[grafana]
name=grafana
baseurl=https://packagecloud.io/grafana/stable/el/7/$basearch
repo_gpgcheck=1
enabled=1
gpgcheck=1
gpgkey=https://packagecloud.io/gpg.key https://grafanarel.s3.amazonaws.com/RPM-GPG-KEY-grafana
sslverify=1
sslcacert=/etc/pki/tls/certs/ca-bundle.crt
YUM
yum -y install grafana
啟動
systemctl start grafana-server
登入 (admin/admin 登入) (首次登入要改預設密碼)
http://1.1.1.1:3000/login
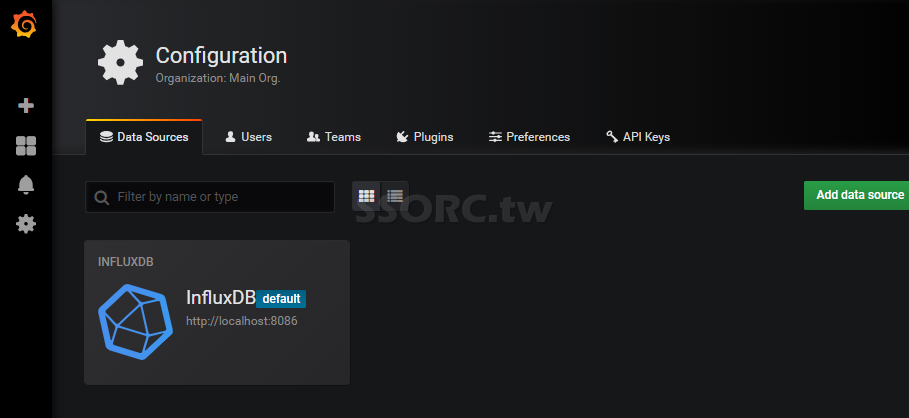
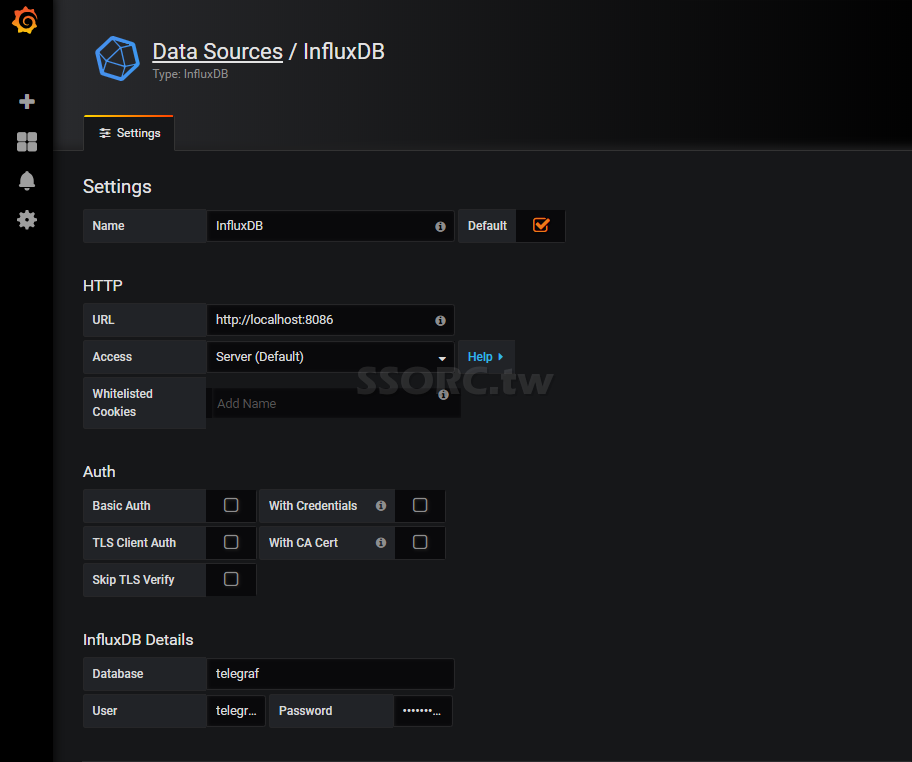
登入後先設定 Data Sources
因為我用 influxdb 當資料庫,理所當然的是資料要從 influxdb 裡拿
Name : InfluxDB
URL : http://localhost:8086
Database : telegraf
User : telegraf
Password : metricsmetricsmetricsmetrics
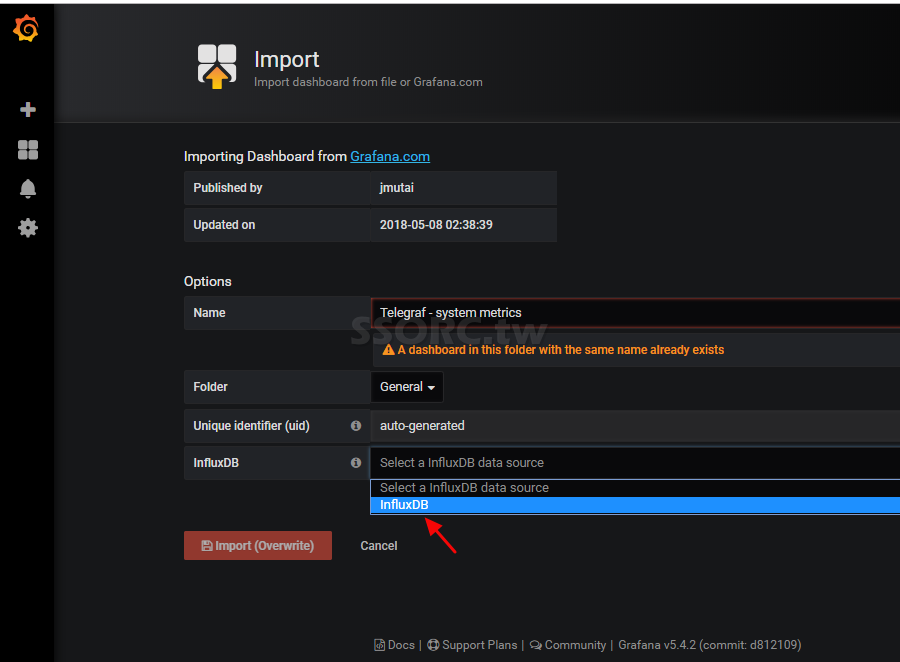
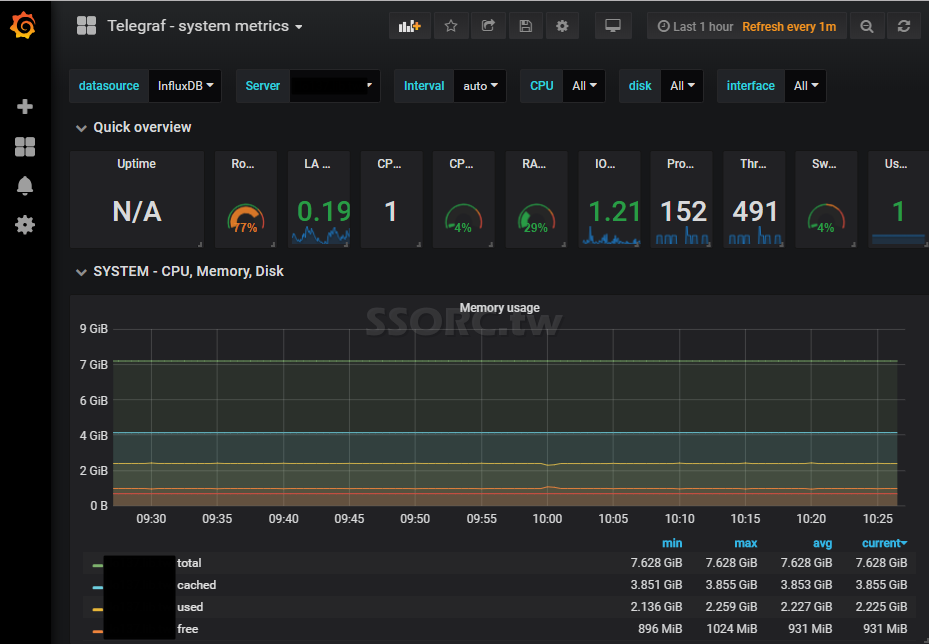
grafana 有專門給 telegraf 的 dashboard,到 https://grafana.com/dashboards/5955 複製它的 id,就是 5955,回到 Grafana 去 + 選擇 import,把 5955 貼到 Grafana.com Dashboard 下方的框框,然後按鈕 Load,選擇 InfluxDB (要先設定) 才可以讓你按 Import
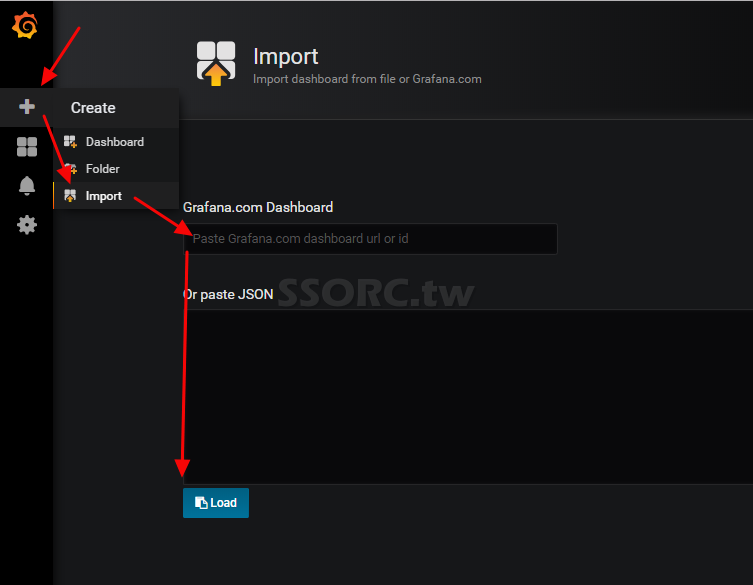
(我這裡已匯過了)
這樣子就可以變出漂亮的畫面了
telegraf 也有 Windows 版本可以下載安裝
https://dl.influxdata.com/telegraf/releases/telegraf-1.9.1_windows_amd64.zip
解開後裡面就兩個檔案
telegraf.conf
telegraf.exe
同樣的設定 telegraf.conf
[[outputs.influxdb]]
  urls = ["http://1.1.1.1:8086"]
  database = "telegraf"
  username = "telegraf"
  password = "metricsmetricsmetricsmetrics"
  skip_database_creation = true
在 CMD 執行 telegraf.exe 卻出現錯誤
2019-01-03T02:02:52Z I! Starting Telegraf 1.9.1
2019-01-03T02:02:52Z E! [telegraf] Error running agent: No config file specified, and could not find one in $TELEGRAF_CONFIG_PATH, /.telegraf/telegraf.conf, or C:\Program Files\Telegraf\telegraf.conf
它不會自己吃當下目錄的設定檔,只好自己指定設定檔,或者把它放到預設地方 (/.telegraf/telegraf.conf, or C:\Program Files\Telegraf\telegraf.conf)
指定設定檔啟動
telegraf.exe --config telegraf.conf
使用 Windows Service 執行
telegraf --service install --config "C:\Program Files\Telegraf\telegraf.conf" --service-name=telegraf
Windows Service 啟動
net start telegraf
要讓 Windows 在 grafana 顯示,以上已設定的不行,要用這個 (有兩種看你要用那種)
https://grafana.com/dashboards/1902
https://grafana.com/dashboards/1635
Q&A
Q 2019-01-03T03:02:31Z W! [outputs.influxdb] when writing to [http://1.1.1.1:8086]: database “telegraf” creation failed: 403 Forbidden
A 在 telegraf.conf 裡設定 skip_database_creation = true
後後後記,開機啟動
systemctl enable influxdb
systemctl enable telegraf
systemctl enable grafana-server

# Windows 就用 Service 啟用就行了
Influxdb 刪除某主機資料
USE telegraf
DROP SERIES WHERE "host" = 'lo137.lib.tw'
留言