
K6 是一套負載測試工具 Load Testing Tool
用 Go 語言寫的,但是測試設定是用 javascript
K6 最初是 Load Impact , Load Impact 之後變成了 K6 , 再來被 Grafana 買去了
而 K6 分 Open Source 及 Cloud 產品線, Cloud 是要錢的,不過有最多 50 人模擬不用錢
底下拿 Open Source 來作測試
(如果想知道各家負載測試工具比較評筆,可看 Open source load testing tool review 2020)
安裝 K6
yum install https://dl.k6.io/rpm/repo.rpm -y
yum install --nogpgcheck k6 -y
寫設定檔
vi script.js
import http from 'k6/http';
import { sleep } from 'k6';

export default function () {
  http.get('https://ssorc.tw');
  sleep(1);
}
執行測試
k6 run script.js
結果
          /\      |‾‾| /‾‾/   /‾‾/
     /\  /  \     |  |/  /   /  /
    /  \/    \    |     (   /   ‾‾\
   /          \   |  |\  \ |  (‾)  |
  / __________ \  |__| \__\ \_____/ .io

  execution: local
     script: script.js
     output: -

  scenarios: (100.00%) 1 scenario, 1 max VUs, 10m30s max duration (incl. graceful stop):
           * default: 1 iterations for each of 1 VUs (maxDuration: 10m0s, gracefulStop: 30s)


running (00m01.1s), 0/1 VUs, 1 complete and 0 interrupted iterations
default   [======================================] 1 VUs  00m01.1s/10m0s  1/1 iters, 1 per VU

     data_received..................: 52 kB 47 kB/s
     data_sent......................: 698 B 635 B/s
     http_req_blocked...............: avg=45.28ms min=45.28ms med=45.28ms max=45.28ms p(90)=45.28ms p(95)=45.28ms
     http_req_connecting............: avg=2.96ms  min=2.96ms  med=2.96ms  max=2.96ms  p(90)=2.96ms  p(95)=2.96ms
     http_req_duration..............: avg=51.53ms min=51.53ms med=51.53ms max=51.53ms p(90)=51.53ms p(95)=51.53ms
       { expected_response:true }...: avg=51.53ms min=51.53ms med=51.53ms max=51.53ms p(90)=51.53ms p(95)=51.53ms
     http_req_failed................: 0.00% ✓ 0       ✗ 1
     http_req_receiving.............: avg=12.75ms min=12.75ms med=12.75ms max=12.75ms p(90)=12.75ms p(95)=12.75ms
     http_req_sending...............: avg=185.3µs min=185.3µs med=185.3µs max=185.3µs p(90)=185.3µs p(95)=185.3µs
     http_req_tls_handshaking.......: avg=35.09ms min=35.09ms med=35.09ms max=35.09ms p(90)=35.09ms p(95)=35.09ms
     http_req_waiting...............: avg=38.58ms min=38.58ms med=38.58ms max=38.58ms p(90)=38.58ms p(95)=38.58ms
     http_reqs......................: 1     0.91013/s
     iteration_duration.............: avg=1.09s   min=1.09s   med=1.09s   max=1.09s   p(90)=1.09s   p(95)=1.09s
     iterations.....................: 1     0.91013/s
     vus............................: 1     min=1     max=1
     vus_max........................: 1     min=1     max=1
如果要模擬 10 人 , 並持續 30 秒
k6 run --vus 10 --duration 30s script.js
或者在 js 裡
import http from 'k6/http';
import { sleep } from 'k6';
export const options = {
  vus: 10,
  duration: '30s',
};
export default function () {
  http.get('https://ssorc.tw');
  sleep(1);
}
如果要模擬不同時間不同人數
30 秒內為 20 人, 1 分 30 秒內為 10 人,剩 20 秒為 0 人 , 且狀態要是 200
import http from 'k6/http';
import { check, sleep } from 'k6';

export const options = {
  stages: [
    { duration: '30s', target: 20 },
    { duration: '1m30s', target: 10 },
    { duration: '20s', target: 0 },
  ],
};

export default function () {
  const res = http.get('https://ssorc.tw');
  check(res, { 'status was 200': (r) => r.status == 200 });
  sleep(1);
}
K6 支援輸出的格式
讓你可以將結果輸出至以下平台
- Amazon CloudWatch
- Apache Kafka (deprecated)
- Cloud
- CSV
- Datadog
- Grafana Cloud / Prometheus
- InfluxDB
- JSON
- Netdata
- New Relic
- Prometheus
- StatsD
輸出成 JSON 格式
可以這麼作
k6 run script.js --out json=output.json
或者
使用 grafana + influxdb 圖形介面
(參考 使用 influxdb + telegraf + grafana 收集主機資料、監控,並圖形化分析)
先在 influxdb 設好資料庫
create database k6db
create user k6user with password 'k6password'
grant all on k6db to k6user
確認連線 OK
curl -G http://1.1.1.1:8086/query -u k6user:k6password --data-urlencode "q=SHOW DATABASES"
influx -username 'k6user' -password 'k6password'
就可以加上 –out 參數輸出至 influxdb
k6 run --out influxdb=http://localhost:8086/k6db script.js
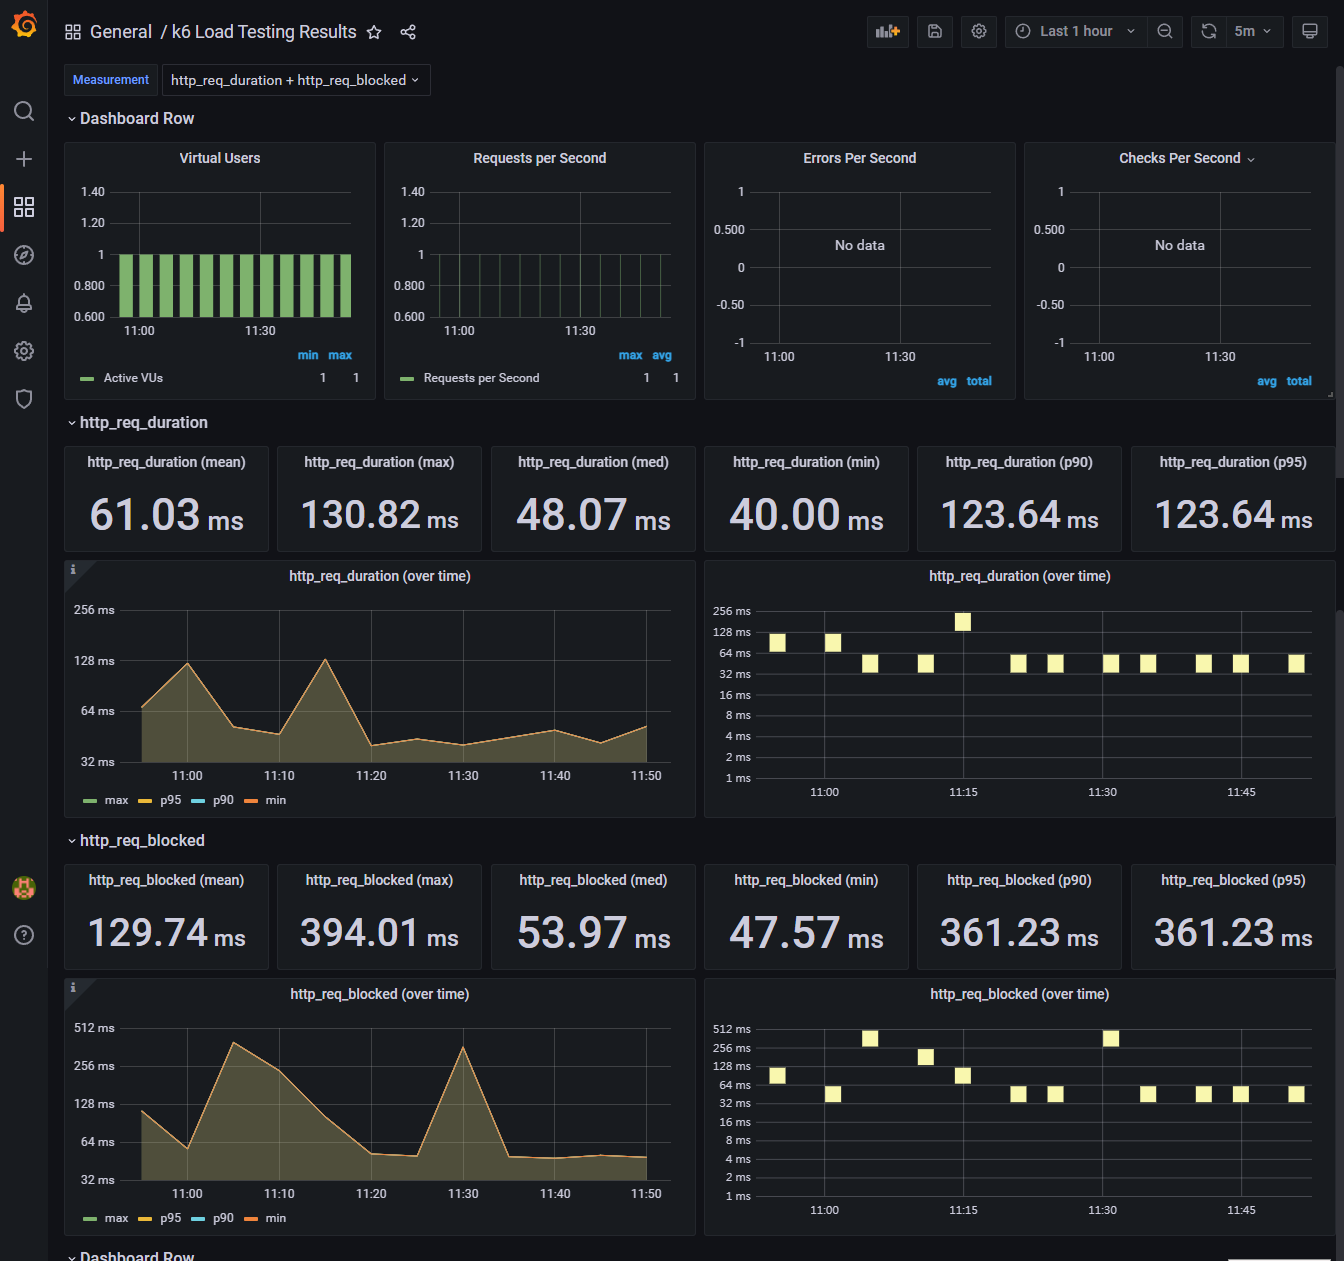
使用 grafana 來顯示結果 (範本 )
留言