
Monitoring, Intrusion Detection, Administration System
http://midas-nms.sf.net
新增監控主機
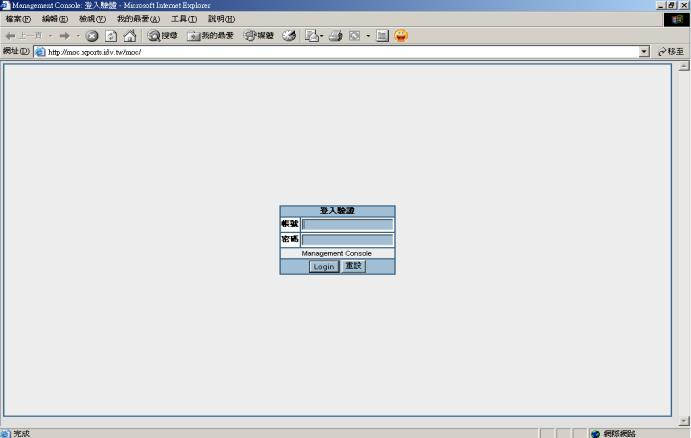
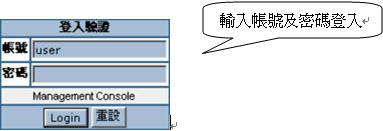
[1.] 登入畫面 http://10.10.1.106/MIDAS
預設帳號/密碼為admin/password
[2.] 新增群組/主機,組態 -> 主機群組/主機
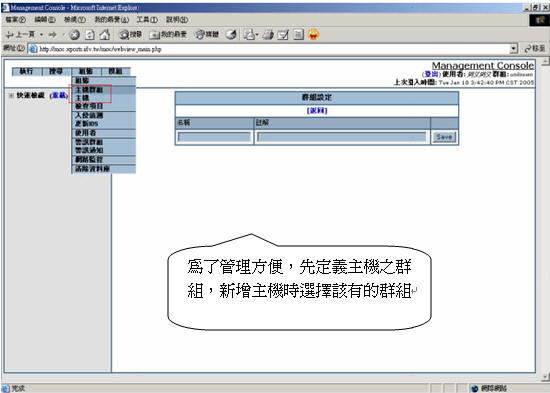
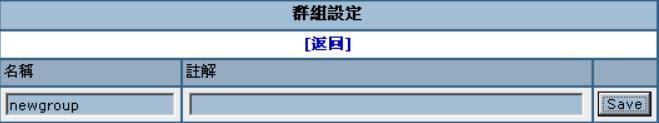
[3.] 新增群組
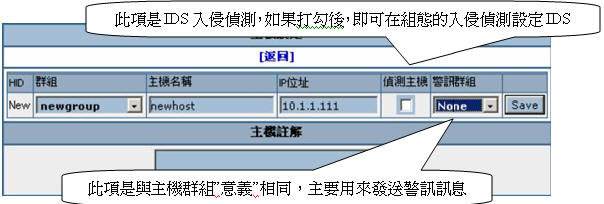
[4.] 新增主機
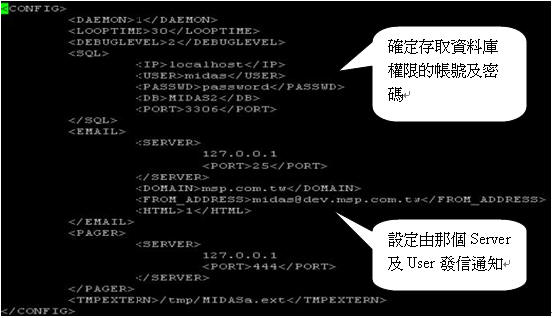
[5.] 新增主機前也要編輯MOC Server上的設定檔MIDASd.cf,讓Server允許Client丟資料到Server的資料庫裡
vi /usr/local/MIDAS/etc/MIDASd.cf
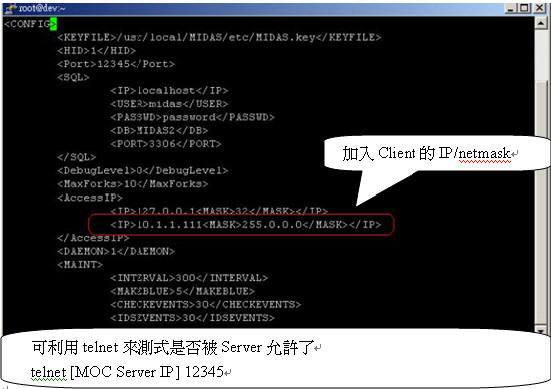
記得 MIDASd必需重新啟動,使之生效
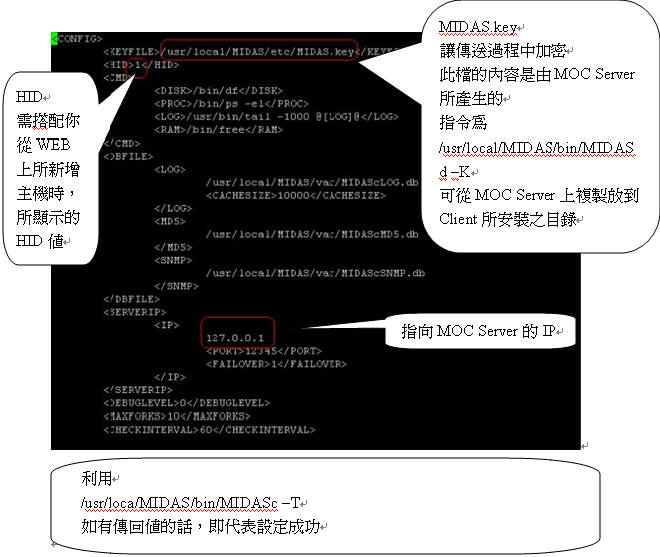
[6.] 並編輯Client端的MIDASc.cf
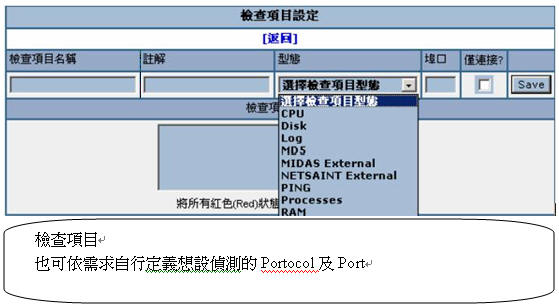
6. 加入檢查項目給主機,進行服務偵測
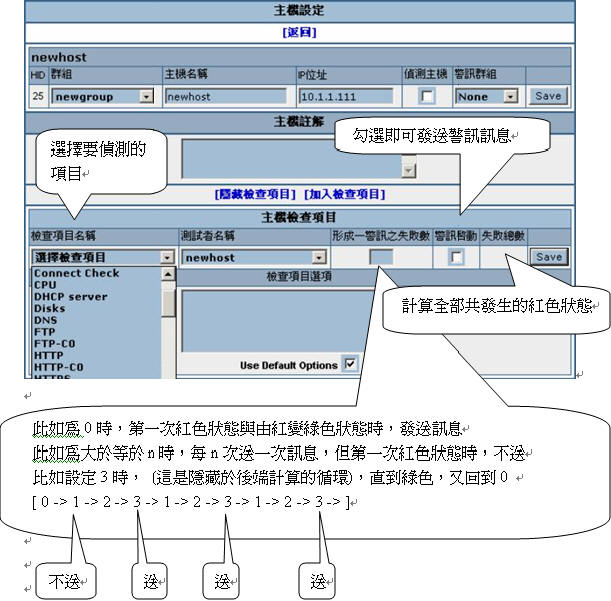
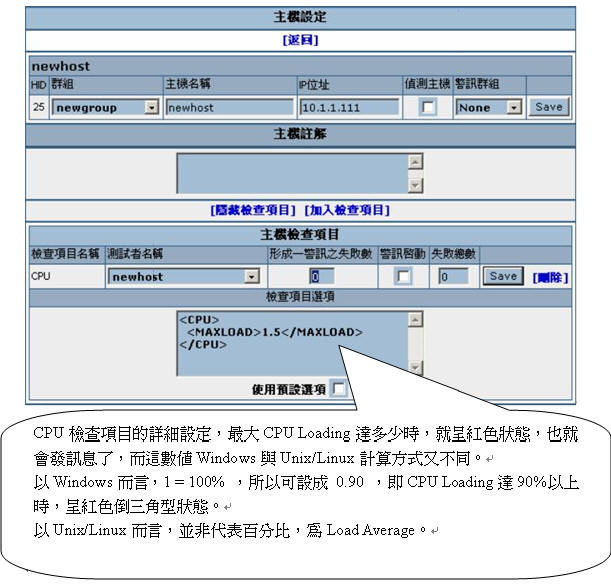
7. 選擇檢查項目的細部設定
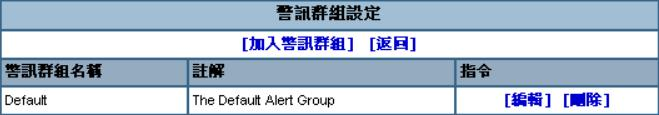
加入警訊設定
如在發生紅色狀態時,發Email通知相關人員,或寫其它程式,用external型態作通知的功能,此設定也是依群組來區分,先設定警訊群組,
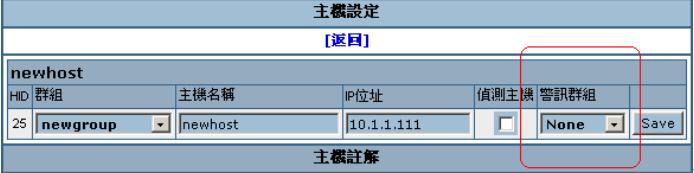
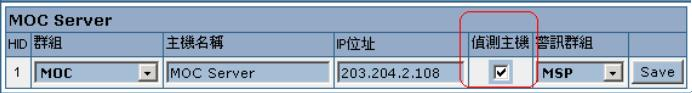
再把主機分配給該群組,主機設定畫面的警訊群組
設定好警訊群組後,接下來設定警訊通知,好讓發生紅色狀態時,利用Email的方式依警訊群組寄信給特定的Email收件者

記得到Server上的MIDASa.cf作設定,Server才會發Alert
網路監控主機設定,Client端的MIDASn.cf
再到web介面的組態 -> 網路監控,加入網路監控主機
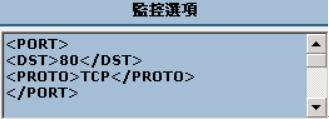
規則為
<PORT>
<SRC>[Source Port]</SRC>
<DST>[Dest. Port]</DST>
<PROTO>[Protocol: TCP/UDP]</PROTO>
</PORT>
<PORT>
<SRC>[Source Port]</SRC>
<DST>[Dest. Port]</DST>
<PROTO>[Protocol: TCP/UDP]</PROTO>
</PORT>
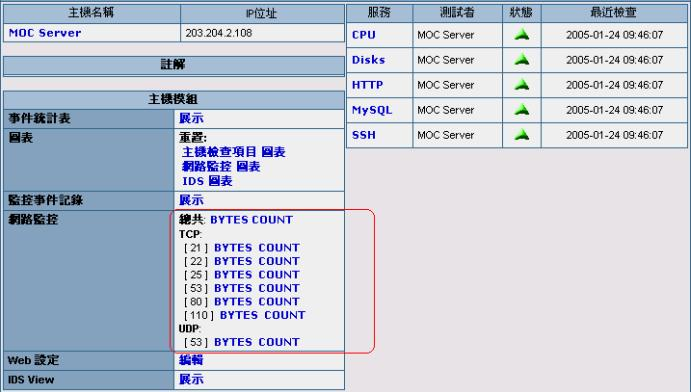
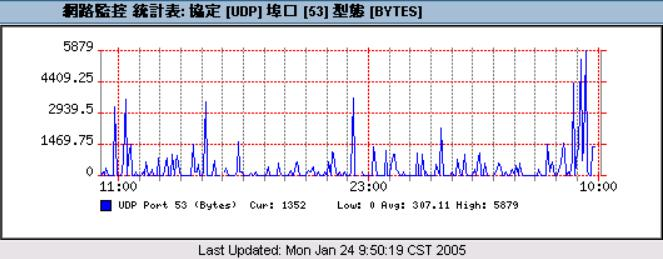
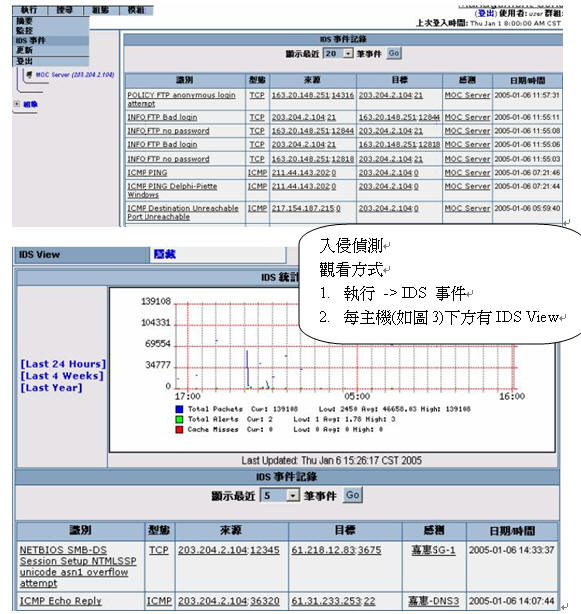
網路監控觀看介面
入侵偵測
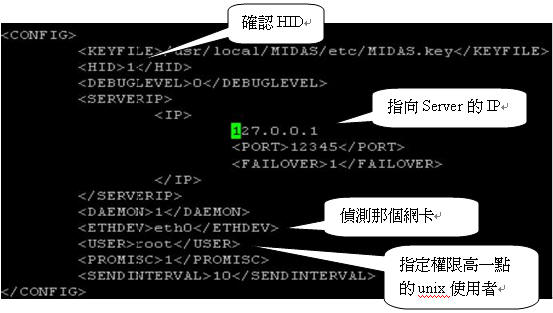
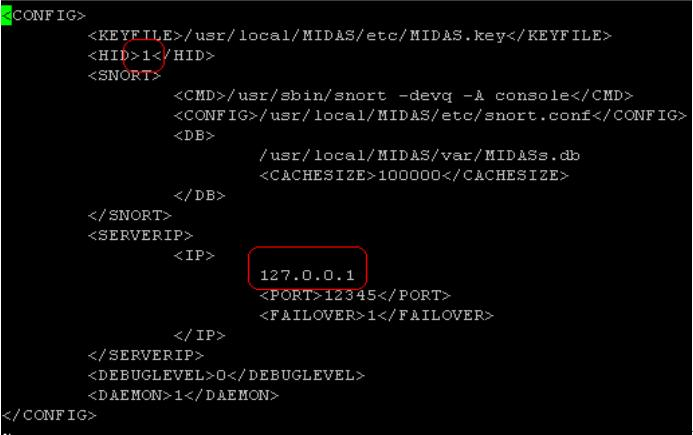
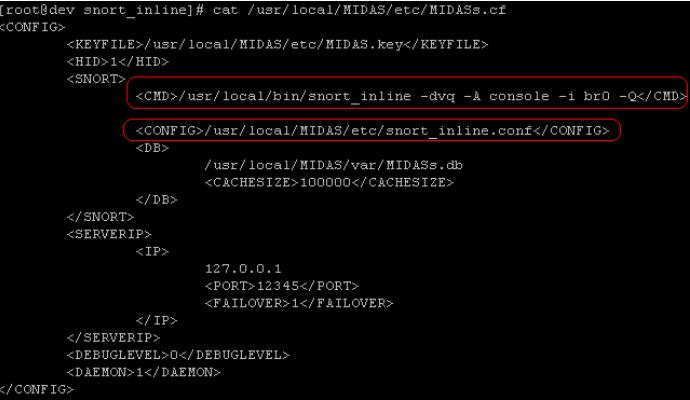
編輯MIDASs.cf,確認兩項,HID及ServerIP
當我們在主機設定裡,如有打勾偵測主機
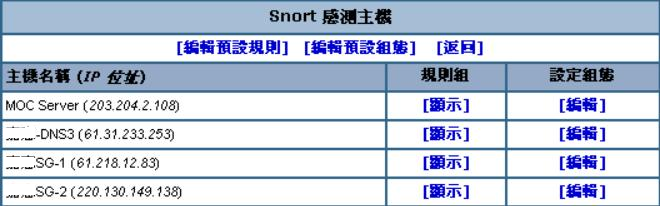
在組態 -> 入侵偵測 裡就會出現可設定IDS的主機
組態中另有個更新IDS項目,此所更新的設定檔及規則只更動預設的項目裡,
如果你要每個主機也要更新,需手動進入各主機做手動更新。
當我們啟動Client端的MIDASs時,它的設定檔會從Server抓取,所以為了以防錯誤發生,
可以啟動MIDASs後再把MIDASs停止,利用snort -T -c snort.conf作測試,直到設定檔無錯誤為止
一般使用者介面使用說明
首頁登入畫面
登入後畫面
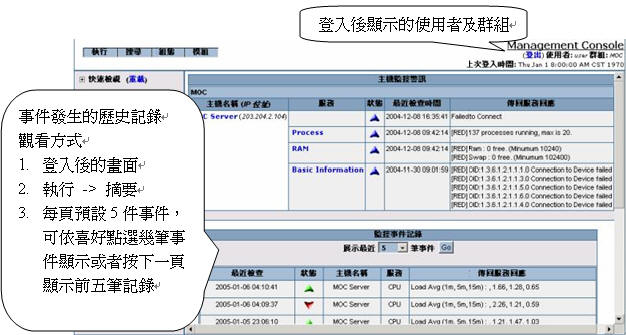
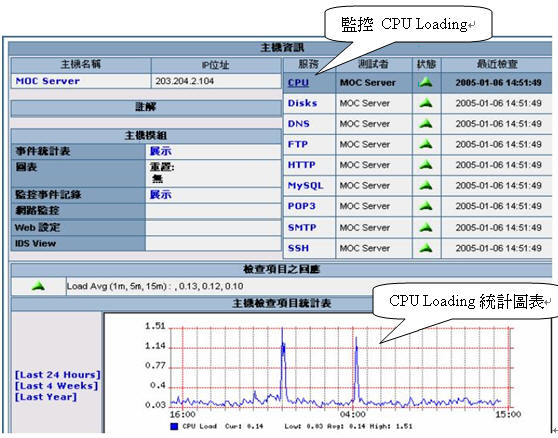
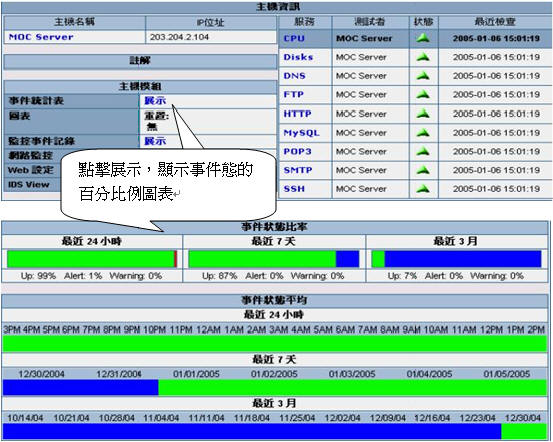
主機監控畫面
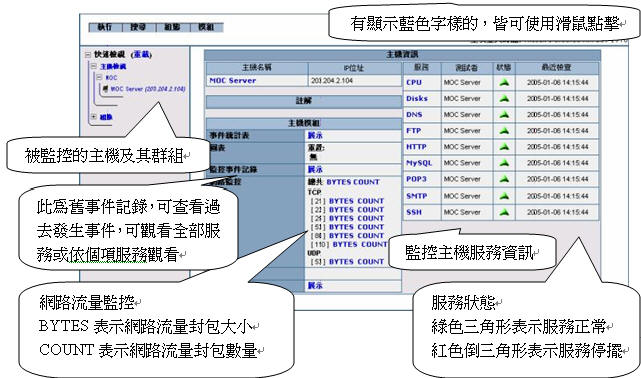
服務資訊畫面
事件狀態畫面
入侵偵測監控畫面
[Q4:] min # of failures
[A4:] 0 -> 第一次紅送,中間的所有紅不送,及最後的綠送
3 -> 第一次紅不送,等三次紅送,及最後的綠送
-> 另一情況,第一次紅不送,等了兩次紅,第三次為綠,綠紅alert都不送
[Q5:] midas's cpu load
[A5:] for windows refers CPU usage percentage
for linux/unix refers to the CPU LOAD value, not CPU usage percentage , as the uptime command
[Q.] How does MIDASc work?
[A.] MIDASc does a TCP port connect() on port 80. If the connection is succesful then it produces a GREEN status, if it fails then it produces a RED status. This is done internaly (within check_network.c) and not with an external application (like telnet).
[Q.] What is the "byte" and "count" in the host view's network monitor of midas webview
[A.] the BYTE link gives you a graph based on traffic in bytes and the COUNT link gives you a graph based on traffic in packets
[Q.] Why no any email alert to send for me under blue status ?
[A.]
Currently Blue statuses are not considered an error since they just mean that a client hasnt reported a status in a certian amount of time.
I am in the process of rewriting the Alert processing code so that it will be possible to design your own alerting rules and allow a much greater
flexability without having to rewrite the source code everytime.
2006-01-16記錄
external check
External Ping hinet
<EXTERNAL>
<COMMAND>/bin/ping 168.95.1.1 -c1 | grep "bytes from" | awk '{print $7}' | cut -d'=' -f2</COMMAND>
<LOGIC>LESS</LOGIC>
<EXPECT>33</EXPECT>
</EXTERNAL>
External Blk_read/s
<EXTERNAL>
<COMMAND>/usr/bin/iostat -d | grep hdc | awk '{print $3}'</COMMAND>
<LOGIC>LESS</LOGIC>
<EXPECT>100</EXPECT>
</EXTERNAL>
External Blk_wrtn/s
<EXTERNAL>
<COMMAND>/usr/bin/iostat -d | grep hdc | awk '{print $4}'</COMMAND>
<LOGIC>LESS</LOGIC>
<EXPECT>100</EXPECT>
</EXTERNAL>
MIDAS-NMS + Snort-Inline
MIDASs
Snort -> snort-inline
在webview的intrusion detection新增的sensor主機,不要加入rules set,我們要用snort_inline所使用的預設路徑/etc/snort_inline 和 drop-rules 路徑。
而每個主機的configuration就是拿snort_inline 的snort_inline.conf設定檔,而rule set 也是直接由snort_inline.conf來決定。
MIDASs.cf設定檔的設定 : 如圖
當你在webview設定完時,啟動MIDASs程式,馬上把它stop,因為要先測式設定檔是否working。這時會在/usr/local/MIDAS/etc/下有個snort_inline.conf檔,
MIDASs每次重新啟動都會去Server上抓新設定,所以snort_inline.conf一定會跟server上的設定更改而更改。
此時指令來測試先,
snort_inline -dvq -A console -i br0 –Q –c snort_inline.conf
會有兩個錯誤
一個是找不到unicode.map,解決方法,從snort_inline原本的設定目錄裡,複制unicode.map到/usr/local/MIDAS/etc底下。
第二個問題是output,解決方法,把snort_inline.conf設定檔裡的
#output alert_full: snort_inline-full
#output alert_fast: snort_inline-fast
註解掉
留言