
Windows 效能監控工具 Perfmon(Performance Monitor)
Windows 自帶的效能監控工具,有圖有表,可監 CPU、記憶體、網路、磁碟、程序 等等
這裡要講指令建立方式,主要針對 IIS 網站的
至於有那些資源物件可以用呢 ?
秀出可用的計數器
typeperf -q -o PerfMon_Counters_All.txt
或者用 Get-Counter
(Get-Counter -ListSet "*").counter
列出 Web Service 的
(Get-Counter -ListSet "Web Service").counter
建一個檔案 E:\cross\PerfMon_Counters.txt ,內容放需要用的幾個物件
\Processor(*)\% Processor Time
\Processor(*)\% User Time
\Memory\Available MBytes
\Web Service(*)\Bytes Total/sec
\Web Service(*)\Current Connections
\Web Service(*)\Maximum Connections
再來我們就利用 logman 指令直接建立效能監視器
logman create counter perflog_cross -cf E:\cross\PerfMon_Counters.txt -o E:\cross\perflogs -si 60 -cnf 300 -max 200
logman create counter <自訂名稱>
-cf  : 計數器檔
-○   : 將資料存到 E:\cross\perflogs , perflogs 是檔案前置名稱,它會自己叫作 perflogs_000001.blg
-si  : 每 60 秒抽樣一次
-cnf : 持續 300 秒後輪替 (舊檔 perflogs_000002.blg)
-max : 檔案最大上限為 200MB
       一定要有 -cnf 搭配 -max 才會生效,就看那一個先達到就輪替 (或 每五分鐘為一個檔案)
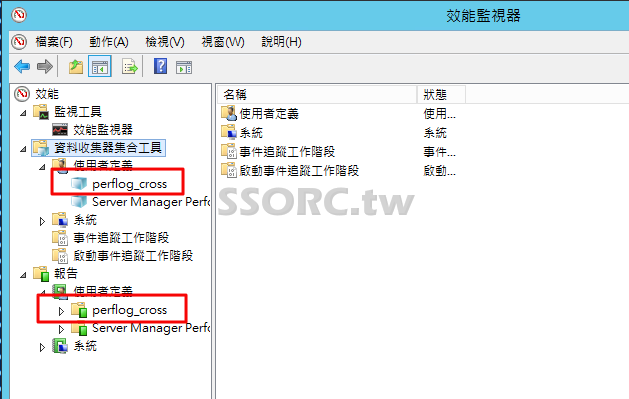
打開控制台 ( perfmon.msc ),就可以看到建立的 perflog_cross 名稱
啟動,開始收集資料
logman start perflog_cross
不過你無法馬上檢視到資料 (仍收集中),可以先停掉,再去點擊打開 E:\cross\perflogs_000001.blg
它就會如同打開效能監視器控制台一樣,這時就可在視窗的左上角有 檢視目前的活動(Ctrl+T) ,點它就可以看到即時訊息
logman stop perflog_cross
如果要刪除
logman delete perflog_cross
再者
我們可以用 Get-Counter 也可以立馬看到數據
列出總數 Current Connections
Get-Counter "\Web Service(_total)\Current Connections"
連續輸出
Get-Counter -Continuous
也可加入 -SampleInterval 2 -MaxSamples 100 為每 2 秒一次,持續 100 次
Get-Counter "\Web Service(_total)\Current Connections" -SampleInterval 2 -MaxSamples 100
列出每個站的 Current Connections
Get-Counter "\Web Service(*)\Current Connections"
列出單一站台的 Current Connections
Get-Counter "\Web Service(ssorc.tw)\Current Connections"
只輸出站台與數值,然後 sort and top 10
Get-Counter "\Web Service(*)\Current Connections" | Select-Object -Expand countersamples | Select-Object -Property CookedValue,InstanceName | Sort-Object -Property CookedValue | Select-Object -Last 10
迴圈跑 ( counter.ps1 )
while(1 -eq 1) {
    Write-Output "----------------------------------------------------------------------------------------------------"
    Write-Output "Current Connections"
    Get-Counter "\Web Service(*)\Current Connections" | Select-Object -Expand countersamples | Select-Object -Property CookedValue,InstanceName | Sort-Object -Property CookedValue | Select-Object -Last 10
    Write-Output "Bytes Total/sec"
    Get-Counter "\Web Service(*)\Bytes Total/sec" | Select-Object -Expand countersamples | Select-Object -Property CookedValue,InstanceName | Sort-Object -Property CookedValue | Select-Object -Last 10
    Write-Output "Processor Time"
    Get-Counter "\Processor(_total)\% Processor Time" | Select-Object -Expand countersamples | Select-Object -Property CookedValue,InstanceName
    Write-Output "User Time"
    Get-Counter "\Processor(_total)\% User Time" | Select-Object -Expand countersamples | Select-Object -Property CookedValue,InstanceName
    # sleep 2 # 也不用 sleep 了,上面就跑超過 2 秒了,如果 IIS 站台很多的話
}
留言