
Fedora Core release 6 (Zod)
1. ) 套件安裝
yum install nagios nagios-plugins-all
2. ) 設定檔,複製範本
cp cgi.cfg-sample cgi.cfg
cp commands.cfg-sample commands.cfg
cp localhost.cfg-sample localhost.cfg
cp nagios.cfg-sample nagios.cfg
cp private/resource.cfg-sample private/resource.cfg
測試設定檔無誤
nagios -v /etc/nagios/nagios.cfg
啟動 nagios
nagios -d /etc/nagios/nagios.cfg
或者
service nagios start
查看狀態 nagiostats
Nagios Stats 2.9
Copyright (c) 2003-2007 Ethan Galstad (www.nagios.org)
Last Modified: 04-10-2007
License: GPLCURRENT STATUS DATA
—————————————————-
Status File: /var/log/nagios/status.dat
Status File Age: 0d 0h 0m 7s
Status File Version: 2.9Program Running Time: 0d 0h 20m 30s
Nagios PID: 11204
Used/High/Total Command Buffers: 0 / 0 / 4096
Used/High/Total Check Result Buffers: 0 / 2 / 4096Total Services: 5
Services Checked: 5
Services Scheduled: 5
Active Service Checks: 5
Passive Service Checks: 0
Total Service State Change: 5.860 / 5.860 / 5.860 %
Active Service Latency: 0.037 / 0.212 / 0.153 sec
Active Service Execution Time: 0.029 / 0.289 / 0.088 sec
Active Service State Change: 5.860 / 5.860 / 5.860 %
Active Services Last 1/5/15/60 min: 2 / 5 / 5 / 5
Passive Service State Change: 0.000 / 0.000 / 0.000 %
Passive Services Last 1/5/15/60 min: 0 / 0 / 0 / 0
Services Ok/Warn/Unk/Crit: 0 / 0 / 0 / 5
Services Flapping: 0
Services In Downtime: 0Total Hosts: 1
Hosts Checked: 1
Hosts Scheduled: 0
Active Host Checks: 1
Passive Host Checks: 0
Total Host State Change: 4.140 / 4.140 / 4.140 %
Active Host Latency: 0.000 / 0.000 / 0.000 sec
Active Host Execution Time: 0.034 / 0.034 / 0.034 sec
Active Host State Change: 4.140 / 4.140 / 4.140 %
Active Hosts Last 1/5/15/60 min: 1 / 1 / 1 / 1
Passive Host State Change: 0.000 / 0.000 / 0.000 %
Passive Hosts Last 1/5/15/60 min: 0 / 0 / 0 / 0
Hosts Up/Down/Unreach: 0 / 1 / 0
Hosts Flapping: 0
Hosts In Downtime: 0
3. ) Web 界面
vi /etc/httpd/conf.d/nagios.conf
ScriptAlias /nagios/cgi-bin/ /usr/lib/nagios/cgi-bin/
<Directory /usr/lib/nagios/cgi-bin/>
Options ExecCGI
order deny,allow
deny from all
allow from 127.0.0.1 10.1.1.0/24
AuthType Basic
AuthUserFile /etc/nagios/password
AuthName "nagios"
require valid-user
</Directory>
Alias /nagios/ /usr/share/nagios/html/
<Directory /usr/share/nagios/html/>
Options None
order deny,allow
deny from all
allow from 127.0.0.1 10.1.1.0/24
AuthType Basic
AuthUserFile /etc/nagios/password
AuthName "nagios"
require valid-user
</Directory>
apachectl graceful
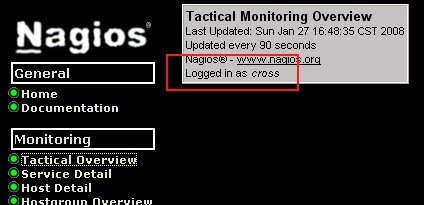
htpasswd -c /etc/nagios/password cross
使用 cross/cross 登入 http://ssorc.tw/nagios/
參考:
1. nagios Document
2. http://www.debianhelp.co.uk/nagios.htm
3. http://www.weithenn.idv.tw/cgi-bin/wiki.pl?Nagios-%E6%8F%90%E4%BE%9B%E9%AB%98%E6%95%88%E8%83%BD%E5%92%8C%E9%AB%98%E6%BA%96%E7%A2%BA%E6%80%A7%E7%9A%84%E7%B6%B2%E8%B7%AF%E7%9B%A3%E6%8E%A7%E8%BB%9F%E9%AB%94
留言